
User Manual
Page 65
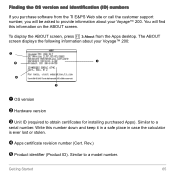
... Similar to a model number. Finding the OS version and identification (ID) numbers If you will find this number down and keep it in a safe place in case the calculator is ever lost or stolen. Í Apps certificate revision number (Cert. The ABOUT screen displays the following information about your Voyage™ 200: Ê Î...
... Similar to a model number. Finding the OS version and identification (ID) numbers If you will find this number down and keep it in a safe place in case the calculator is ever lost or stolen. Í Apps certificate revision number (Cert. The ABOUT screen displays the following information about your Voyage™ 200: Ê Î...

User Manual
Page 93
... variables appropriate for v0, q, and g. Press ... B or A as necessary Previews 93 Graph the parametric equations to the next variable. Steps and keystrokes 3. Then move to model the path of the ball. Press 8 % 6.
... variables appropriate for v0, q, and g. Press ... B or A as necessary Previews 93 Graph the parametric equations to the next variable. Steps and keystrokes 3. Then move to model the path of the ball. Press 8 % 6.

User Manual
Page 370
...Axes = TIME. On the Y= Editor (8 #), define the sequences and initial values for Rn and Wn. Sequence Graphing 370 Example: Predator-Prey Model Using the predator-prey model in a certain region. R = Number of rabbits M = Growth rate of rabbits if there are no rabbits (use .0002) D =... Death rate of rabbits and foxes that maintain population equilibrium in biology, determine the numbers of foxes if there are initially 200 rabbits and 50 foxes. 2. u1...
...Axes = TIME. On the Y= Editor (8 #), define the sequences and initial values for Rn and Wn. Sequence Graphing 370 Example: Predator-Prey Model Using the predator-prey model in a certain region. R = Number of rabbits M = Growth rate of rabbits if there are no rabbits (use .0002) D =... Death rate of rabbits and foxes that maintain population equilibrium in biology, determine the numbers of foxes if there are initially 200 rabbits and 50 foxes. 2. u1...

User Manual
Page 435
... of the corresponding differential equation, regardless of whether that maintain population equilibrium in a certain region. Example of Time and Custom Axes Using the predator-prey model from biology, determine the numbers of all selected differential equations (y1', y2', etc.) y1, y2, etc. - Item Description X Axis, Y Axis Active only when Axes = CUSTOM...
... of the corresponding differential equation, regardless of whether that maintain population equilibrium in a certain region. Example of Time and Custom Axes Using the predator-prey model from biology, determine the numbers of all selected differential equations (y1', y2', etc.) y1, y2, etc. - Item Description X Axis, Y Axis Active only when Axes = CUSTOM...

User Manual
Page 436
Differential Equation Graphing 436 Predator-Prey Model Use the two coupled 1st-order differential equations: y1' = Ly1 + 0.1y1 ùy2 and y2' = 3y2 Ny1 ùy2 where: y1 = Population of foxes yi1 = Initial population of foxes (2) y2 = Population of rabbits yi2 = Initial population of rabbits (5) 1. Use 3 to set Graph = DIFF EQUATIONS. 2. With FLDOFF, all equations are evaluated even if they are not selected. Note: To speed up graphing times, clear any other equations in the Y= Editor. In the Y= Editor (8 #), define the differential equations and enter the initial conditions.
Differential Equation Graphing 436 Predator-Prey Model Use the two coupled 1st-order differential equations: y1' = Ly1 + 0.1y1 ùy2 and y2' = 3y2 Ny1 ùy2 where: y1 = Population of foxes yi1 = Initial population of foxes (2) y2 = Population of rabbits yi2 = Initial population of rabbits (5) 1. Use 3 to set Graph = DIFF EQUATIONS. 2. With FLDOFF, all equations are evaluated even if they are not selected. Note: To speed up graphing times, clear any other equations in the Y= Editor. In the Y= Editor (8 #), define the differential equations and enter the initial conditions.

User Manual
Page 439
...Graph screen, which displays a curve for each pair of the equation's exact solution. Example Comparison of RK and Euler Consider a logistic growth model dP/dt = .001ùPù(100NP), with a graph of initial conditions. 14. 12. Use the BldData instruction to specify more than ... and enter the initial conditions shown below. Differential Equation Graphing 439 yi1={2,6,7} and yi2={5,12,18} Note: Use a list to compare the graphing points calculated by the RK and Euler solution methods. Because t0=0 and tmax=10, you can trace in the range 0 t 10. Note...
...Graph screen, which displays a curve for each pair of the equation's exact solution. Example Comparison of RK and Euler Consider a logistic growth model dP/dt = .001ùPù(100NP), with a graph of initial conditions. 14. 12. Use the BldData instruction to specify more than ... and enter the initial conditions shown below. Differential Equation Graphing 439 yi1={2,6,7} and yi2={5,12,18} Note: Use a list to compare the graphing points calculated by the RK and Euler solution methods. Because t0=0 and tmax=10, you can trace in the range 0 t 10. Note...

User Manual
Page 540
.../Matrix Editor module for details on entering data in the Data/Matrix Editor. 3. Statistics and Data Plots Overview of the steps used to perform a statistical calculation or graph a statistical plot. Define the viewing window (8 $). Enter stat data in Statistical Analysis This section gives an overview of Steps in the Data/Matrix... can also use the Y= Editor to FUNCTION. 2. Statistics and Data Plots 540 Set Graph mode (3) to define and select stat plots and y(x) functions. 5. Perform stat calculations to find stat variables or fit data to...
.../Matrix Editor module for details on entering data in the Data/Matrix Editor. 3. Statistics and Data Plots Overview of the steps used to perform a statistical calculation or graph a statistical plot. Define the viewing window (8 $). Enter stat data in Statistical Analysis This section gives an overview of Steps in the Data/Matrix... can also use the Y= Editor to FUNCTION. 2. Statistics and Data Plots 540 Set Graph mode (3) to define and select stat plots and y(x) functions. 5. Perform stat calculations to find stat variables or fit data to...

User Manual
Page 546
... displayed on the STAT VARS screen. Summary points medx1, medy1, medx2, medy2, medx3, and medy3 are calculated and stored to the model y=a/(1+bùe^(cùx))+d and updates all the system statistics variables. Fits the data to the model equation y=a+b ln(x) using the medianmedian line, which is the y-intercept) using a least-squares fit and transformed...
... displayed on the STAT VARS screen. Summary points medx1, medy1, medx2, medy2, medx3, and medy3 are calculated and stored to the model y=a/(1+bùe^(cùx))+d and updates all the system statistics variables. Fits the data to the model equation y=a+b ln(x) using the medianmedian line, which is the y-intercept) using a least-squares fit and transformed...

User Manual
Page 547
Fits the data to the model equation y=axb using a least-squares fit and transformed values ln(x) and ... the second-order polynomial y=ax2+bx+c. From the Home Screen or a Program Use the applicable command for the calculation that you want to perform. Refer to the fourth-order polynomial y=ax4+bx3+cx2+ dx+e. Fits the data...mode setting. Note: For TwoVar and all the system statistics variables. Quartic regression - Calculates the sinusoidal regression and updates all regression calculations, the columns that you specify for information about each command. You must have the same...
Fits the data to the model equation y=axb using a least-squares fit and transformed values ln(x) and ... the second-order polynomial y=ax2+bx+c. From the Home Screen or a Program Use the applicable command for the calculation that you want to perform. Refer to the fourth-order polynomial y=ax4+bx3+cx2+ dx+e. Fits the data...mode setting. Note: For TwoVar and all the system statistics variables. Quartic regression - Calculates the sinusoidal regression and updates all regression calculations, the columns that you specify for information about each command. You must have the same...
User Manual
Page 727
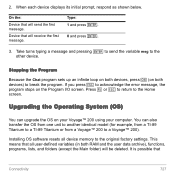
...can upgrade the OS on the Program I/O screen. When each device displays its initial prompt, respond as shown below. If you press N to a Voyage™ 200). This means that will send the first message. Type: 1 and press ¸. 0 and press ¸. 3. Upgrading the Operating System (OS) ...can also transfer the OS from one unit to another identical model (for example, from a TI-89 Titanium to a TI-89 Titanium or from a Voyage™ 200 to acknowledge the error message, the program stops on your Voyage™ 200 using your computer. It is possible that will receive the ...
...can upgrade the OS on the Program I/O screen. When each device displays its initial prompt, respond as shown below. If you press N to a Voyage™ 200). This means that will send the first message. Type: 1 and press ¸. 0 and press ¸. 3. Upgrading the Operating System (OS) ...can also transfer the OS from one unit to another identical model (for example, from a TI-89 Titanium to a TI-89 Titanium or from a Voyage™ 200 to acknowledge the error message, the program stops on your Voyage™ 200 using your computer. It is possible that will receive the ...

User Manual
Page 942
At least four data points are calculated. ExpReg Uses the least-squares algorithm and transformed values x and ln(y) to fit the model equation: y=abx LinReg Uses the least-squares algorithm to fit the model equation: y=ax+b where a is the slope and b is the dimension of the lists This ...technique attempts to recursively estimate the constants in the model expression to make J as small as possible. Regression Formulas This section describes how the statistical regressions are required. Least-Squares Algorithm Most...
At least four data points are calculated. ExpReg Uses the least-squares algorithm and transformed values x and ln(y) to fit the model equation: y=abx LinReg Uses the least-squares algorithm to fit the model equation: y=ax+b where a is the slope and b is the dimension of the lists This ...technique attempts to recursively estimate the constants in the model expression to make J as small as possible. Regression Formulas This section describes how the statistical regressions are required. Least-Squares Algorithm Most...

User Manual
Page 943
... the least-squares algorithm and transformed values ln(x) and y to fit the model equation: y=a+b ln(x) Uses the least-squares algorithm to fit the model equation: y=a/(1+b*e^(c*x))+d Uses the median-median line (resistant line) technique to calculate summary points x1, y1, x2, y2, x3, and y3, and fits... the model equation: y=ax+b where a is the slope and b is a polynomial fit; Uses the...
... the least-squares algorithm and transformed values ln(x) and y to fit the model equation: y=a+b ln(x) Uses the least-squares algorithm to fit the model equation: y=a/(1+b*e^(c*x))+d Uses the median-median line (resistant line) technique to calculate summary points x1, y1, x2, y2, x3, and y3, and fits... the model equation: y=ax+b where a is the slope and b is a polynomial fit; Uses the...

User Manual
Page 963
... software and any documentation supplied with a reconditioned model of an equivalent quality (at TI's option) when the product is longer. TI strongly recommends that the software will continue for the warranty of the repaired or replacement unit will be made for value prior to Texas Instruments Service Facility. Warranty Performance. Other than the...
... software and any documentation supplied with a reconditioned model of an equivalent quality (at TI's option) when the product is longer. TI strongly recommends that the software will continue for the warranty of the repaired or replacement unit will be made for value prior to Texas Instruments Service Facility. Warranty Performance. Other than the...

User Manual
Page 964
...software will be either repaired or replaced with this product are protected by the consumer or any documentation supplied with a new or reconditioned model of an equivalent quality (at TI's option) when the product is provided "AS IS." The software and any other causes not arising..., so the above one (1) year from jurisdiction to the original point of defects in the One-Year Limited Warranty for this product, Texas Instruments does not promise that you insure the product for such repair and/or replacement. Except as expressly provided in materials or construction. Warranty ...
...software will be either repaired or replaced with this product are protected by the consumer or any documentation supplied with a new or reconditioned model of an equivalent quality (at TI's option) when the product is provided "AS IS." The software and any other causes not arising..., so the above one (1) year from jurisdiction to the original point of defects in the One-Year Limited Warranty for this product, Texas Instruments does not promise that you insure the product for such repair and/or replacement. Except as expressly provided in materials or construction. Warranty ...

User Manual
Page 982
... solver 132 oscillating web plots 368 parametric graphing 92, 760 path of a ball 92 polar rose 94 pole-corner problem 737 population 117 predator-prey model 370, 435 prime factors 70 programming 126, 129, 636 Pythagorean theorem 737 quadratic formula 739 rational factors 769 real factors 769 reducing expressions 73 sampling...
... solver 132 oscillating web plots 368 parametric graphing 92, 760 path of a ball 92 polar rose 94 pole-corner problem 737 population 117 predator-prey model 370, 435 prime factors 70 programming 126, 129, 636 Pythagorean theorem 737 quadratic formula 739 rational factors 769 real factors 769 reducing expressions 73 sampling...