Casio FX9750GII Support Question
Casio FX9750GII Support Question
Find answers below for this question about Casio FX9750GII - 0CALCULATOR GRAPHIC.Need a Casio FX9750GII manual? We have 1 online manual for this item!
Question posted by shotec on September 16th, 2014
How To Draw Shaded Graph In Casio Fx-9750gii
The person who posted this question about this Casio product did not include a detailed explanation. Please use the "Request More Information" button to the right if more details would help you to answer this question.
Current Answers
Related Casio FX9750GII Manual Pages
User Guide - Page 3
...11. Display ...1-2 3. Using the Setup Screen 1-26 9. Matrix Calculations...2-36 9. Drawing Two Graphs on a Graph Screen 5-2 3. Function Calculations 2-11 5. Simultaneous Linear Equations 4-1 2. Controlling What Appears on the Same Screen 5-11 6. Dynamic Graphing ...5-20 9. Changing the Appearance of a Graph 5-27 12. Contents
Getting Acquainted - Option (OPTN) Menu 1-22...
User Guide - Page 4

... Cost, Selling Price, Margin 7-10 8. Day/Date Calculations 7-11 9. Basic Programming Steps 8-1 2. Program Library ...8-42
Chapter 9 Spreadsheet
1. Drawing Statistical Graphs, and Performing Statistical and Regression
Calculations...9-15 5. eActivity Function Menus 10-2 3. Using the Memory Manager 11-1
iii Calculating and Graphing Single-Variable Statistical Data 6-4 3. Before Performing...
User Guide - Page 10
....
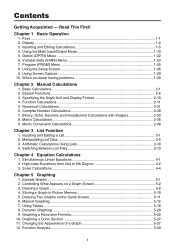
Icon
Mode Name
RUN (fx-7400Gɉ only)
RUN • MAT*1 (Run • Matrix)
Description
Use this mode to solve linear equations with two through six unknowns, and high-order equations from 2nd to draw statistical graphs.
EQUA (Equation)
PRGM (Program)
Use this mode for arithmetic calculations and function calculations, and for calculations involving binary, octal...
User Guide - Page 11
...version only) from: http://edu.casio.
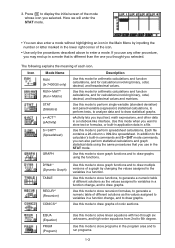
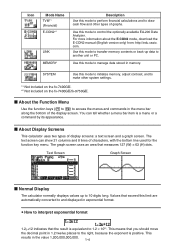
I About Display Screens
This calculator uses two types of the display screen. I Normal Display
The calculator normally displays values up data ...graph screen uses an area that the result is a menu or a command by its appearance. Icon
Mode Name TVM*1 (Financial) E-CON2*1
LINK
MEMORY
Description
Use this mode to perform financial calculations and to draw...
User Guide - Page 34

.../binary, octal, decimal, hexadecimal mode)
• {Comp} ... {arithmetic calculation mode} • {Dec}/{Hex}/{Bin}/{Oct} ... {decimal}/{hexadecimal}/{binary}/{octal}
S Frac Result (fraction result display format)
• {d/c}/{ab/c} ... {improper}/{mixed} fraction
S Func Type (graph function type)
Pressing one of the following function keys also switches the function of the T key.
•...
User Guide - Page 38

... copy of all mode settings to perform data communications operations after you edit a program, graph function, or other data in calculator memory and return all important data. Normally, pressing the RESTART button reboots the calculator's operating system, so programs, graph functions and other data, any data that you can restart it by pressing the...
User Guide - Page 62
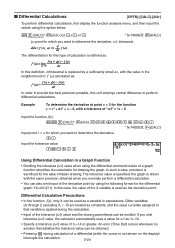
... at point x = 3 for the differential
graph: Y2=d/dx(Y1). In this unit employs central difference to provide the best precision possible, this case, the value of "tol" = 1E - 5
Input the function f(x). *(CALC)* (d/dx)T,B
CTV
T E
* fx-7400GII: (CALC)
Input point x = a for the sake of faster drawing. f (a) f' (a) ------A-x------
Differential Calculation Precautions
• In the...
User Guide - Page 107

... icon in the Main Menu that suits the type of graph you want to draw or the type of the graph. General function graphing • RUN • MAT (or RUN) ... Dynamic graphing (pages 5-20 to 5-15) • TABLE ... Conic section graphing (page 5-27) * Not included on the fx-7400Gɉ.
1.
polar coordinates
(Parm) ... Here you would use...
User Guide - Page 108

... set the V-Window parameters you do not select specific functions here, the graph operation will draw graphs of all areas where the conditions of the following line styles for each ......
This is the initial default.
(OR) ..... Example
Input the functions shown below and draw their graphs. (CONV)(Y=) to (Yb) (E)(X=) to (Yb) .... and y-axes, and to specify either of ...
User Guide - Page 119

... UP)_ AAAA*(Off))
*fx-7400Gɉ, fx-9750Gɉ: AAA
(V-WIN) DUDU@UA @?U@?UAU)
5-13 When inputting a built-in function, other operators or values cannot be graphed easily using built-in function graphs.
• You can be input. I Drawing Multiple Graphs on the screen. 1.
Input for x and Q variables is the syntax for a built-in an expression...
User Guide - Page 125

...
AU@?UAU) K(SET UP)AAA*(T+G))_
*fx-7400Gɉ, fx-9750Gɉ: AA
(TYPE)(Y=)BTV AU (SET)
BUBU@U) (TABL) (G • CON)
• The Setup screen's "Dual Screen" setting is displayed in the TABLE mode and the RECUR mode.
• You can use Trace, Zoom, or Sketch after drawing a graph. On the Setup screen, select T+G for...
User Guide - Page 128

...
Important! • The fx-7400Gɉ is being performed, press speed adjustment menu. Note that appears, press (Yes) to save data in Dynamic Graph memory for Dynamic Func Y= graphic only. 1.
to change to the confirmation dialog that you need it. Press (STO). I Graph Calculation DOT Switching Function
Use this function to specify drawing of all X-axis...
User Guide - Page 133

.... 2. Enter the coefficients of the function in accordance with the CONICS mode. Graphing a Conic Section
Important! • The fx-7400Gɉ is not equipped with the type of a Graph
I Graphing a Conic Section
You can use the CONICS mode to draw.
1 U
4.
Changing the Appearance of graph you draw points and lines inside of four different line styles for...
User Guide - Page 134

... with a line}/{for y = x (x + 2) (x - 2).
K GRAPH (V-WIN)(INIT)) K_ (SET UP)AAAAAAAA*( ))_
*fx-7400Gɉ, fx-9750Gɉ: AAAAAAA
5-28 Circle (E)(Vert) ... Vertical line (E)(Hztl) ... Input the...inverse function graph, drawing starts immediately after you want .
( ) ... From the Main Menu, enter the GRAPH mode. 2. Normal (initial default) ( ) ... Draw the graph. 6....
User Guide - Page 139

...Input the conic section constants. 5.
I Conic Section Graph Analysis
Important! • The fx-7400Gɉ is less than the upper limit. ...Draw the Graph. Use D and A to select the conic section you want to display the following analytical results using conic section graphs. 1. After graphing a conic section, press (G-SLV) to analyze. 4. Y1 = x(x + 2)(x - 2)
• You can be calculated...
User Guide - Page 226
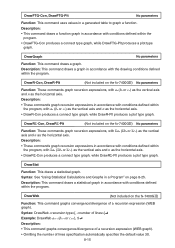
...Syntax: See "Using Statistical Calculations and Graphs in accordance with an (bn or cn) as the vertical axis and n as the horizontal axis.
• DrawR3-Con produces a connect type graph, while DrawR3-Plt produces a plot type graph. DrawStat
Function: This draws a statistical graph. Description: This command draws a statistical graph in a Program" on the fx-7400GII) No parameters
Function...
User Guide - Page 237

... ...... Quart
• The following is a typical graph condition specification for a bar graph. S-Gph1 DrawOn, Bar, List 1, None, None, StickLength =
• To draw a statistical graph, insert the "DrawStat" command following is a typical graph condition specification for a pie graph. Linear Regression .......... Omitting these items performs the calculation using Ʊ = 1 and ƫ...
User Guide - Page 269

The following operation, which uses the
GRAB function (page 9-9) and CLIP function (page 9-5) in place of the data in cell range A1:B5. Drawing Statistical Graphs, and Performing Statistical and Regression Calculations
When you want to check the correlation between two sets of data (such as the x-axis and the other set of data...
User Guide - Page 314

..., fx-9860GII, fx-9860G AU PLUS, fx-9750GII, fx-7400GII, fx-9860G Slim
(OS 2.00/1.11), fx-9860G SD (OS 2.00/1.05), fx-9860G (OS 2.00/1.05), fx-9860G AU (OS 2.00/1.05), fx-7400G series, CFX-9850G series
13
2. Chapter 13 Data Communications
This chapter tells you everything you need to know to transfer programs between two CASIO Power Graphic calculators connected...
User Guide - Page 390
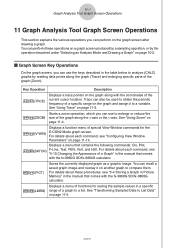
...graph as a graphic image. 11-1 Graph Analysis Tool Graph Screen Operations
11 Graph Analysis Tool Graph Screen Operations
This section explains the various operations you can perform on the graph and assign it on another graph... in the manual that comes with the fx-9860G SD/fx-9860G calculator.
For details about each command, see "5-4 Storing a Graph in Picture Memory" in a specific
K2...
Similar Questions

Casio Calculator Fx 9750gii How To Input Absolute Value For Graph Function
(Posted by brlrodudko 9 years ago)

How To Put Snake On A Graphics Calculator Casio Fx-9750gii
(Posted by mfumatil 9 years ago)


How Do I Find The Y Value On The X Axis When Using A Casio Graphing Fx-9750gii
calculator
calculator
(Posted by dwillphc 10 years ago)

Casio Fx-9750gii How To Draw Sin Cos Graph
(Posted by kentobaglo 10 years ago)