
TDR100 Time Domain Reflectometry Systems
Page 40
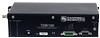
...-point window before the probe. Waveform and derivative values near probe indexmax_derivative max_deriv 840 860 880 900 920 940 960 980 1000 data point waveform waveform derivative values used for point of signal attenuation are returned. threshold = a*(maximum derivative) + b*(mean... 0 b = 1 c = 2 Therefore the default threshold is the mean from step 3) + c*(standard deviation from step 3) waveform and derivative near TDR probe and locations of the values in the window must be below the threshold value. The green band represents the results of the 4 parameters are...
...-point window before the probe. Waveform and derivative values near probe indexmax_derivative max_deriv 840 860 880 900 920 940 960 980 1000 data point waveform waveform derivative values used for point of signal attenuation are returned. threshold = a*(maximum derivative) + b*(mean... 0 b = 1 c = 2 Therefore the default threshold is the mean from step 3) + c*(standard deviation from step 3) waveform and derivative near TDR probe and locations of the values in the window must be below the threshold value. The green band represents the results of the 4 parameters are...